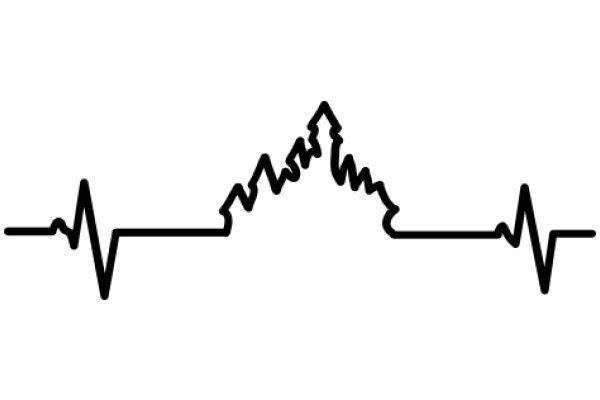
The image displays a simple, black and white line graph. The graph consists of a series of peaks and valleys, which represent fluctuations in a certain metric or data set. The peaks are higher than the valleys, indicating periods of higher values or activity. The valleys are lower than the peaks, indicating periods of lower values or activity. The graph is set logo, which contrasts with the black lines of the graph, making it easy to read and interpret. The style of the image is minimalistic and straightforward, focusing solely on the graph without any additional decorative elements.
Like
Electrocardiogram (ECG) Signal Analysis: A Visual Guide to Understanding Heart Rhythm
$22.95 USD Sale price $20.00 USD
Design this TShirt
Design this Mug
Design this Sticker
Download for personal use
Product
Add to cartShare on Facebook
Share on X
Share on Pinterest
Other Designs

_Heart_Rate_Monitoring_Graphic.jpg)